English
 中文简体
中文简体 русский
 عربى
عربى
Contenido
- 1 What Is the Viscosity of Polyamide 6?
- 2 Types of Viscosity Used to Characterize Polyamide 6
- 3 How Temperature Affects PA6 Melt Viscosity
- 4 The Critical Role of Moisture in PA6 Viscosity
- 5 Molecular Weight and Its Direct Link to Viscosity in PA6
- 6 How Fillers and Reinforcements Change PA6 Viscosity
- 7 Viscosity Comparison: Polyamide 6 vs. Other Engineering Polymers
- 8 Viscosity Models Used for PA6 in Process Simulation
- 9 Measuring PA6 Viscosity in Practice
- 10 Viscosity Degradation During Processing: What to Watch For
- 11 Selecting the Right PA6 Grade Based on Viscosity Requirements
What Is the Viscosity of Polyamide 6?
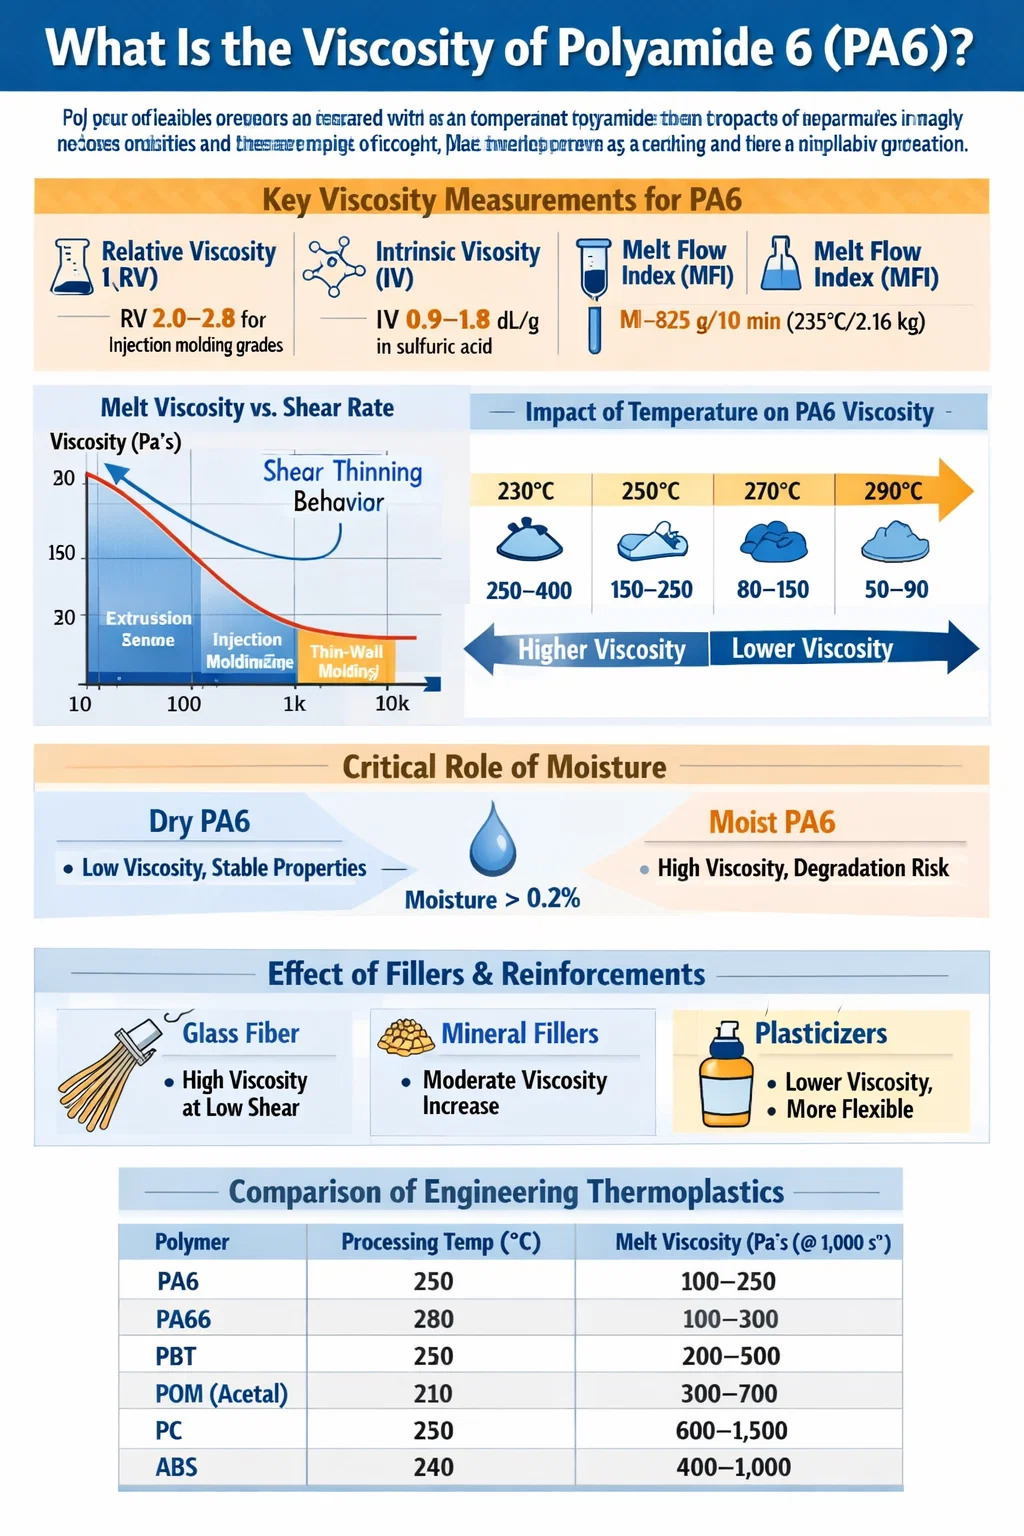
The viscosity of polyamide 6 (PA6) depends heavily on the measurement method, molecular weight, temperature, and moisture content. For practical processing purposes, the melt viscosity of polyamide 6 typically ranges from 100 to 1,000 Pa·s at processing temperatures between 230°C and 280°C, measured at shear rates common in injection molding (100–10,000 s⁻¹). In solution-based characterization, PA6 is commonly described by its relative viscosity (RV) or intrinsic viscosity (IV): standard injection-molding grades have a relative viscosity of 2.0 to 2.8 (measured in 96% sulfuric acid at 1% concentration), while fiber-grade PA6 typically falls between 2.4 and 2.8, and high-viscosity engineering grades can exceed 3.5.
Understanding viscosity is central to every stage of PA6 production and processing — from polymerization control to mold filling behavior. The following sections break down each relevant viscosity type, the factors that influence it, and how to work with it effectively in real manufacturing scenarios.
Types of Viscosity Used to Characterize Polyamide 6
Viscosity is not a single number for PA6 — it is measured in several different ways depending on the application context. Each measurement method reflects a different aspect of the polymer's flow behavior.
Relative Viscosity (RV)
Relative viscosity is the most widely used quality-control metric for PA6 pellets. It compares the flow time of a polymer solution to that of pure solvent in a capillary viscometer. The standard test uses a 1% solution in 96% sulfuric acid at 25°C, following ISO 307. A higher RV indicates higher molecular weight and, in turn, higher melt viscosity. Typical commercial grades cluster as follows:
- Injection molding grades: RV 2.0–2.5
- Extrusion and film grades: RV 2.5–3.2
- Textile fiber grades: RV 2.4–2.8
- Technical yarn and high-tenacity fiber: RV 3.0–3.8
- Cast film and engineering extrusion: RV 3.5–4.5
Intrinsic Viscosity (IV)
Intrinsic viscosity, expressed in dL/g or mL/g, is the limiting value of reduced viscosity at zero concentration. It correlates directly with molecular weight through the Mark-Houwink equation. For PA6 in sulfuric acid, typical IV values range from 0.9 to 1.8 dL/g. This measurement is preferred in academic and R&D settings when an absolute molecular weight relationship is needed.
Melt Flow Index (MFI)
Melt flow index, measured in g/10 min per ISO 1133, provides a single-point snapshot of flow behavior under a defined load and temperature. For PA6, the standard test condition is 235°C with a 2.16 kg load. Typical values:
- General-purpose injection molding: 8–25 g/10 min
- Flow-modified grades: 40–80 g/10 min
- Extrusion grades: 1–5 g/10 min
- Glass-fiber reinforced PA6 (30% GF): 5–12 g/10 min
MFI is practical for incoming quality control but is insufficient for accurate simulation of mold filling because it only captures viscosity at a single, low shear rate.
Melt Viscosity vs. Shear Rate
PA6 is a pseudoplastic (shear-thinning) polymer. Its melt viscosity decreases significantly as shear rate increases. At 250°C, a typical unfilled PA6 injection-molding grade shows:
| Shear Rate (s⁻¹) | Melt Viscosity (Pa·s) | Typical Process Zone |
|---|---|---|
| 10 | 800–1,200 | Low-shear extrusion, compression molding |
| 100 | 300–600 | Extrusion screw zone |
| 1,000 | 100–250 | Injection molding gate/runner |
| 10,000 | 30–80 | Thin-wall injection molding |
This shear-thinning behavior is highly favorable for injection molding: the material flows easily under high shear in the gate and runner system, yet retains structure once it fills the cavity and shear stress drops.
How Temperature Affects PA6 Melt Viscosity
Temperature is the most powerful lever for adjusting PA6 melt viscosity. The relationship is described by an Arrhenius-type model: viscosity decreases exponentially with increasing temperature. The flow activation energy of PA6 is approximately 40–60 kJ/mol, meaning a temperature increase of 10°C reduces melt viscosity by roughly 15–25%.
Practical processing temperatures for PA6 run from 230°C to 290°C. However, sustained temperatures above 290°C accelerate thermal degradation — chain scission occurs, reducing molecular weight and causing viscosity to drop permanently. Color yellowing and loss of mechanical properties follow. For this reason, melt temperature should be matched to the intended process and the specific grade of PA6, not simply maximized for flow.
| Melt Temperature (°C) | Melt Viscosity at 1,000 s⁻¹ (Pa·s) | Notes |
|---|---|---|
| 230 | 250–400 | Near lower processing limit; risk of poor fusion |
| 250 | 150–250 | Standard injection molding target |
| 270 | 80–150 | Thin-wall or complex geometry molding |
| 290 | 50–90 | Upper safe limit; monitor for degradation signs |
The Critical Role of Moisture in PA6 Viscosity
Polyamide 6 is hygroscopic — it absorbs moisture from the atmosphere readily, and this moisture has a dramatic effect on melt viscosity. Water acts as a plasticizer and chain-scission agent at melt temperatures. Even 0.2% moisture content in PA6 pellets can cause a 30–50% reduction in melt viscosity compared to a properly dried sample, along with severe surface defects, splay marks, and a loss of mechanical properties in the finished part.
At melt temperatures, water molecules cleave amide bonds — a process called hydrolytic degradation — permanently reducing molecular weight. This is not recoverable in subsequent drying. The material must be dried before processing, not after any melting event.
Drying Recommendations for PA6
- Target moisture content before processing: below 0.20%, ideally below 0.10%
- Drying temperature: 80°C in a dehumidifying hopper dryer
- Drying time: 4–6 hours for standard 3 mm pellets; up to 8 hours for larger granules
- Dew point of drying air: below −30°C for optimal results
- Moisture measurement method: Karl Fischer titration or loss-on-drying at 150°C
PA6 equilibrium moisture content at ambient conditions (23°C, 50% RH) is approximately 2.5–3.5%. At full saturation in water, it can reach 9–10%. Even brief exposure of dried pellets to ambient air in a humid environment — 30 minutes can be enough on a humid summer day — can raise moisture above acceptable levels. Sealed packaging should be maintained until the material enters the dryer.
Molecular Weight and Its Direct Link to Viscosity in PA6
Molecular weight is the root determinant of PA6 viscosity. The relationship between zero-shear melt viscosity (η₀) and weight-average molecular weight (Mw) follows a power law: η₀ ∝ Mw³·⁴ above the entanglement molecular weight. This means a modest increase in molecular weight produces a disproportionately large increase in viscosity.
For PA6, the entanglement molecular weight (Mc) is approximately 5,000 g/mol, and commercial grades have weight-average molecular weights in the range of 15,000 to 50,000 g/mol. Number-average molecular weight (Mn) for injection-molding grades typically falls between 15,000 and 25,000 g/mol, while high-performance engineering grades may reach Mn of 30,000–40,000 g/mol.
Molecular Weight Distribution Effects
The breadth of the molecular weight distribution (polydispersity index, PDI = Mw/Mn) also matters. PA6 produced by hydrolytic polymerization typically has a PDI of 2.0 to 2.5. A broader distribution (higher PDI) results in more pronounced shear thinning and lower zero-shear viscosity relative to weight-average molecular weight, which can be advantageous for processing complex geometries but may slightly reduce peak mechanical performance.
How Fillers and Reinforcements Change PA6 Viscosity
Commercial PA6 compounds rarely consist of neat polymer alone. Glass fiber, mineral fillers, flame retardants, and other additives all modify melt viscosity significantly.
Glass Fiber Reinforced PA6
Short glass fiber reinforcement, typically at 15–50% by weight, substantially increases melt viscosity at low shear rates but has a relatively smaller effect at high shear rates due to fiber alignment. A PA6 with 30% glass fiber shows melt viscosity approximately 2–4 times higher than unfilled PA6 at shear rates below 100 s⁻¹, but only 1.3–1.8 times higher at shear rates above 1,000 s⁻¹. This non-linear effect must be accounted for in mold flow simulation.
Mineral Fillers
Talc, calcium carbonate, and wollastonite increase viscosity roughly proportionally to filler volume fraction. At 20–30% mineral loading, melt viscosity increases by 50–150% compared to the base PA6, with less shear-thinning compensation than glass fiber. This makes high-mineral-content PA6 compounds more sensitive to processing temperature and screw design.
Impact Modifiers and Plasticizers
Rubber-phase impact modifiers (e.g., EPDM-g-MAH, POE-g-MAH) reduce the matrix stiffness but can slightly increase or decrease melt viscosity depending on the modifier's own viscosity. Plasticizers such as BBSA (N-butylbenzenesulfonamide), typically used at 3–8%, reduce melt viscosity by 20–40% and also lower the glass transition temperature, which extends low-temperature ductility.
Viscosity Comparison: Polyamide 6 vs. Other Engineering Polymers
Understanding where PA6 sits relative to comparable engineering thermoplastics helps in material selection and process design. The table below compares melt viscosity at representative injection-molding conditions.
| Polymer | Processing Temp (°C) | Melt Viscosity at 1,000 s⁻¹ (Pa·s) | Flow Behavior |
|---|---|---|---|
| Polyamide 6 (PA6) | 250 | 100–250 | Excellent fluidity |
| Polyamide 66 (PA66) | 280 | 100–300 | Similar to PA6; slightly stiffer melt |
| PBT | 250 | 200–500 | Good fluidity |
| POM (Acetal) | 200 | 300–700 | Moderate fluidity |
| PC (Polycarbonate) | 300 | 600–1,500 | High viscosity; requires high pressure |
| ABS | 240 | 400–1,000 | Moderate; good shear thinning |
PA6 stands out as one of the most fluid engineering thermoplastics in its class. This low melt viscosity enables thin-wall molding, long flow lengths, and efficient fiber wet-out in reinforced compounds — all of which make it a go-to material for complex injection-molded components in automotive, electronics, and consumer goods.
Viscosity Models Used for PA6 in Process Simulation
Injection molding simulation software such as Moldflow, Cadmould, and Sigmasoft requires accurate rheological models to predict fill pattern, pressure drop, and weld line location. For PA6, two models are most commonly used:
Cross-WLF Model
The Cross-WLF model is the industry standard for thermoplastic melt simulation. It captures both the low-shear Newtonian plateau and the high-shear power-law thinning region, with temperature dependence built into the WLF shift factor. For a typical PA6 injection-molding grade, Cross-WLF parameters include:
- Zero-shear viscosity η₀ at reference temperature: 2,000–8,000 Pa·s at 230°C
- Critical stress τ* (transition from Newtonian to power-law): 20,000–60,000 Pa
- Power-law exponent n: 0.25–0.40
- WLF constants C1, C2: typically 20–30 and 50–100°C respectively
Bird-Carreau Model
The Bird-Carreau model is used in academic and advanced simulation contexts. It describes viscosity as a smooth function from zero-shear plateau to power-law regime. The relaxation time λ for PA6 melt at 250°C is typically 0.001–0.01 s, which defines the onset of shear thinning at shear rates around 100–1,000 s⁻¹.
Both models require experimental data from a capillary rheometer or rotational rheometer. Reliable PA6 rheological data should be collected over a shear rate range of 1 to 10,000 s⁻¹ at a minimum of three temperatures (e.g., 230°C, 250°C, 270°C) to cover the full processing window.
Measuring PA6 Viscosity in Practice
Several instruments and methods are used in industrial and laboratory settings to characterize PA6 viscosity. Choosing the right one depends on the information needed and the available equipment.
Capillary Viscometer (Solution)
Used for relative viscosity measurement per ISO 307. Simple, low-cost, and standard in PA6 pellet production quality control. Requires sulfuric acid handling with appropriate safety controls. Results take 20–40 minutes per sample including dissolution and temperature equilibration.
Melt Flow Indexer
Used for MFI measurement per ISO 1133. Fast, inexpensive, and widely available. Results at a single shear rate only; not suitable for simulation input but adequate for batch-to-batch consistency checks. Requires dried samples. Test duration is typically 10–20 minutes per sample.
Capillary Rheometer
The most important tool for obtaining melt viscosity vs. shear rate data for simulation. Instruments such as the Göttfert Rheograph or Instron capillary rheometer generate viscosity curves from 1 to 10,000+ s⁻¹. Proper Bagley and Rabinowitsch corrections are essential for accurate results. PA6 samples must be dried to below 0.1% moisture before testing to avoid degradation artifacts during measurement.
Rotational Rheometer
Used for low-shear-rate characterization and viscoelastic measurements. Oscillatory shear tests on a rotational rheometer (e.g., Anton Paar MCR, TA Instruments DHR) provide storage modulus (G'), loss modulus (G''), and complex viscosity (η*) across a frequency range of 0.01–100 rad/s. The Cox-Merz rule generally holds for unfilled PA6, allowing frequency sweep data to be converted to shear viscosity data for the low-shear portion of the flow curve.
Viscosity Degradation During Processing: What to Watch For
PA6 is susceptible to both thermal and hydrolytic degradation during melt processing, both of which reduce molecular weight and therefore viscosity. Monitoring viscosity changes is one of the most effective tools for detecting processing problems early.
- Hydrolytic degradation: Caused by residual moisture. Detectable as an unexpectedly low MFI or RV on pellets taken directly from the injection press. A drop in RV of more than 0.1–0.2 units relative to the incoming material typically indicates inadequate drying.
- Thermal degradation: Caused by excess temperature or residence time. Yellowing, black specks, and a sustained MFI increase over a production run are warning signs. Any zone temperature consistently above 295°C in a standard PA6 grade should be corrected immediately.
- Oxidative degradation: Less common in well-maintained machines with inert-purge or closed hopper systems. Manifests as color change and reduction in mechanical properties without a consistent viscosity trend.
- Regrind effects: Reprocessing PA6 reduces molecular weight. Each pass through the extruder or injection press at standard conditions reduces RV by approximately 0.05–0.15 units. Regrind content should typically be limited to 10–20% to preserve properties and viscosity stability.
Selecting the Right PA6 Grade Based on Viscosity Requirements
Material selection should always begin with the end-use requirements and the process. The following table summarizes which PA6 viscosity range to specify for different applications:
| Application | Process | Recommended RV | MFI (g/10 min, 235°C/2.16 kg) |
|---|---|---|---|
| Thin-wall electronics housings | Injection molding | 2.0–2.3 | 20–50 |
| Structural automotive components | Injection molding (GF) | 2.3–2.7 | 5–15 |
| Textile staple fiber | Melt spinning | 2.4–2.6 | 10–20 |
| Technical yarn (tire cord, rope) | High-speed spinning | 3.0–3.8 | 2–6 |
| Cast film and sheet | Flat-die extrusion | 3.2–4.0 | 1–4 |
| Tubing and profile extrusion | Annular die extrusion | 2.8–3.5 | 2–8 |
When selecting a PA6 grade for a new application, it is always advisable to request full rheological data — not just MFI — from the material supplier and to validate it against simulation results before committing to a tool design. Viscosity variation between production lots from the same supplier can be ±0.1–0.15 RV units, and this should be factored into process window planning.